RWS Community
RWS Community
  • Site

Trados Studio

Trados Team

Trados Accelerate

Trados Enterprise

Trados GroupShare

Trados Business Manager

Passolo

MultiTerm

RWS AppStore

Connectors

Beta Groups

Managed Translation

MultiTrans

TMS

Trados Enterprise

WorldServer

Language Weaver

Language Weaver Edge

Language Weaver Connectors

Language Weaver in Trados Studio


Tridion Docs

Tridion Sites

Contenta

LiveContent

XPP

Trados Studio Ideas

Trados GroupShare Ideas

Trados Team Ideas

Trados Team Terminology Ideas

Trados Enterprise & Accelerate Ideas

Trados Business Manager Ideas

MultiTerm Ideas

Passolo Ideas

RWS Appstore Ideas

Tridion Docs Ideas

Tridion Sites Ideas

Language Weaver Ideas

Language Weaver Edge Ideas

Managed Translation - Enterprise Ideas

TMS Ideas

WorldServer Ideas

Trados Enterprise Ideas

XPP Ideas

GroupShare Developers

Language Cloud Developers

MultiTerm Developers

Passolo Developers

Trados Studio Developers

Managed Translation Developers

TMS Developers

WorldServer Developers

Tridion Docs Developers

XPP Developers

Language Combinations by Language Services

RWS Training & Certification

Style Guides

RWS Campus

Trados Approved Trainers

ETUG (European Trados User Group) Public Information

Nordic Tridion Docs User Group

Tridion West Coast User Group

Community Ops

demospace

RWS Community Internal Group

AURORA

Internal Trados Ideas

Linguistic Validation

Mercury

XPP Cloud

Recognition & Reward System

RWS Community Platform Related Questions

Community Solutions Hub (Trados)

Events

RWS Training & Certification

To RWS Support

  • Search
  • Translate

    Detecting language please wait for.......


    Powered by
  • User
  • Site
  • Search
  • User
  • Products
  • Trados Portfolio
  • Trados Business Manager
  • More
  • Cancel
Trados Business Manager
  • Products
  • Trados Portfolio
  • Trados Business Manager
  • More
  • Cancel

Trados Business Manager > Wiki

QuickReport items - Scatter chart
  • Home
  • Blog and Product Updates
  • Forums
  • Wiki
  • Ideas
  • Docs
  • More
  • Cancel
  • New
Show Translation Options

Detecting language please wait for.......


Powered by
Trados Business Manager requires membership for participation - click to join
  • Wiki
  • +Licensing & Installation
  • -TBM 6
    • +Release Notes
    • +Basic Information
    • Quick Start
    • +Database engine
    • +Software configuration
    • +List views and data entry forms: usage and customization
    • Dashboards
    • +Reference data
    • +Documents
    • +Security system
    • +Service functions
    • +Data export and import
    • -Reports and analytics
      • +Custom reports
      • Ledger
      • -QuickReports
        • Built-in QuickReports
        • +Calculated fields
        • -Default widgets
          • QuickReport items - Cards
          • QuickReport items - Chart
          • QuickReport items - Choropleth map
          • QuickReport items - Gauges
          • QuickReport items - Grid
          • QuickReport items - Group
          • QuickReport items - Pies
          • QuickReport items - Pivot
          • QuickReport items - Range filter
          • QuickReport items - Scatter chart
          • QuickReport items - Tab container
        • Parameters
      • Vendors workload
    • +Invoice templates and custom reports
    • API
    • +Portal for customers
    • +Portal for Vendors
    • +Integrations in Business Manager
    • +CV
  • +Trados Business Manager Connector plugin
  • +Trados Business Manager plugin
  • +FAQ
  • TBM 5 documentation
  • Download links for older versions

QuickReport items - Scatter chart

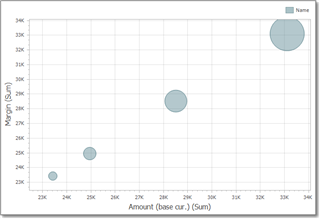
You can use the Scatter Charts to visualize relationships between numeric variables. The image below shows a sample Scatter Chart item that is bound to data.
To bind the Scatter Chart item to data, drag and drop a data source field to a placeholder contained in one of the available data sections. A table below lists and describes Scatter Chart data sections.

Section

Processed as

Description

X-Axis

Measure

Contains the data item against which the X-coordinates of data points are calculated.

Y-Axis

Measure

Contains the data item against which the Y-coordinates of data points are calculated.

Weight

Measure

Contains the data item whose values are used to calculate the weight of data points.

Arguments

Dimension

Contains data items providing scatter chart arguments that are used to create data points.

Tags:

reporting
scatter
Analytics
chart
quickreports
  • Share
  • History
  • More
  • Cancel
Related
Recommended
  • Our Terms of Use
  • Copyright
  • Privacy
  • Security
  • Anti-slavery Statement
  • Cookie Notice
  • YouTube