RWS Community
RWS Community
  • Site

Trados Studio

Trados Team

Trados Accelerate

Trados Enterprise

Trados GroupShare

Trados Business Manager

Passolo

MultiTerm

RWS AppStore

Connectors

Beta Groups

Managed Translation

MultiTrans

TMS

Trados Enterprise

WorldServer

Language Weaver

Language Weaver Edge

Language Weaver Connectors

Language Weaver in Trados Studio


Tridion Docs

Tridion Sites

Contenta

LiveContent

XPP

Trados Studio Ideas

Trados GroupShare Ideas

Trados Team Ideas

Trados Team Terminology Ideas

Trados Enterprise & Accelerate Ideas

Trados Business Manager Ideas

MultiTerm Ideas

Passolo Ideas

RWS Appstore Ideas

Tridion Docs Ideas

Tridion Sites Ideas

Language Weaver Ideas

Language Weaver Edge Ideas

Managed Translation - Enterprise Ideas

TMS Ideas

WorldServer Ideas

Trados Enterprise Ideas

XPP Ideas

GroupShare Developers

Language Cloud Developers

MultiTerm Developers

Passolo Developers

Trados Studio Developers

Managed Translation Developers

TMS Developers

WorldServer Developers

Tridion Docs Developers

XPP Developers

Language Combinations by Language Services

RWS Training & Certification

Style Guides

RWS Campus

Trados Approved Trainers

ETUG (European Trados User Group) Public Information

Nordic Tridion Docs User Group

Tridion West Coast User Group

Community Ops

demospace

RWS Community Internal Group

AURORA

Internal Trados Ideas

Linguistic Validation

Mercury

XPP Cloud

Recognition & Reward System

RWS Community Platform Related Questions

Community Solutions Hub (Trados)

Events

RWS Training & Certification

To RWS Support

  • Search
  • Translate

    Detecting language please wait for.......


    Powered by
  • User
  • Site
  • Search
  • User
  • Products
  • Trados Portfolio
  • Trados Business Manager
  • More
  • Cancel
Trados Business Manager
  • Products
  • Trados Portfolio
  • Trados Business Manager
  • More
  • Cancel

Trados Business Manager > Wiki

QuickReport items - Grid
  • Home
  • Blog and Product Updates
  • Forums
  • Wiki
  • Ideas
  • Docs
  • More
  • Cancel
  • New
Show Translation Options

Detecting language please wait for.......


Powered by
Trados Business Manager requires membership for participation - click to join
  • Wiki
  • +Licensing & Installation
  • -TBM 6
    • +Release Notes
    • +Basic Information
    • Quick Start
    • +Database engine
    • +Software configuration
    • +List views and data entry forms: usage and customization
    • Dashboards
    • +Reference data
    • +Documents
    • +Security system
    • +Service functions
    • +Data export and import
    • -Reports and analytics
      • +Custom reports
      • Ledger
      • -QuickReports
        • Built-in QuickReports
        • +Calculated fields
        • -Default widgets
          • QuickReport items - Cards
          • QuickReport items - Chart
          • QuickReport items - Choropleth map
          • QuickReport items - Gauges
          • QuickReport items - Grid
          • QuickReport items - Group
          • QuickReport items - Pies
          • QuickReport items - Pivot
          • QuickReport items - Range filter
          • QuickReport items - Scatter chart
          • QuickReport items - Tab container
        • Parameters
      • Vendors workload
    • +Invoice templates and custom reports
    • API
    • +Portal for customers
    • +Portal for Vendors
    • +Integrations in Business Manager
    • +CV
  • +Trados Business Manager Connector plugin
  • +Trados Business Manager plugin
  • +FAQ
  • TBM 5 documentation
  • Download links for older versions

QuickReport items - Grid

Grid allows you to present data in tabular form. To bind the Grid dashboard item to data, drag and drop a data source field to a placeholder contained in one of the available data sections.

About this task
The Grid dashboard item supports four types of columns.

  • Dimension Column - displays grouped values from the bound data item and allows you to provide discrete categorical information.
  • Measure Column - displays summaries calculated against data in the bound data item.
  • Delta Column - bound to two measures, calculates summaries for both measures, and displays the difference between these summaries.
  • Sparkline Column - displays values in the bound data item using sparklines.

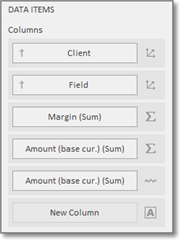
When you drop a data item into the Columns section, the type for the new column is determined automatically based on the data type. The type of the column is indicated within the corresponding data item container in the DATA ITEMS area.

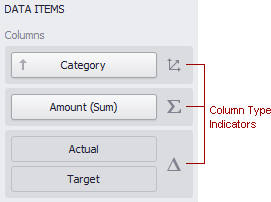
Column type indicators are defined as follows.

To change the column type, select the column type indicator. In the Column Options window, select the column type from the Column type section.

The dimension column displays values from the bound data item "as is".

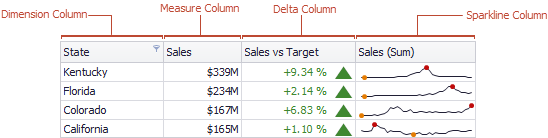
If the dimension column is bound to a data source containing images, it can display images.

A measure column displays summaries calculated against data in the bound data item. Values in the measure column can be displayed as text or represented by bars.

To select between these modes, open the Column Options window and select Value or Bar.

If bars are displayed, use the Always show zero level check box to specify whether the bar zero level is always visible.
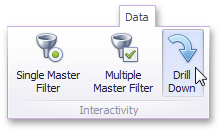
Drill-down

The built-in drill-down capability allows end-users to change the detail level of data displayed in dashboard items on the fly. The Grid item supports drill-down for rows. When drill-down is enabled, you can select a grid row to view the details. Drill-down requires that the Columns section contains several dimensions at the top, from the least detailed to the most detailed dimension.


To enable drill-down, select Drill Down in the Data ribbon tab.

To return to the previous detail level (drill up), use the corresponding button within the Grid caption, or the Drill Up command in the context menu.

Conditional formatting

The Grid item supports the conditional formatting feature that provides the capability to apply formatting to grid cells whose values meet the specified condition. This feature allows you to highlight specific cells or entire rows using a predefined set of rules. To create a new format rule for the Grid's dimension/measure, do one of the following.
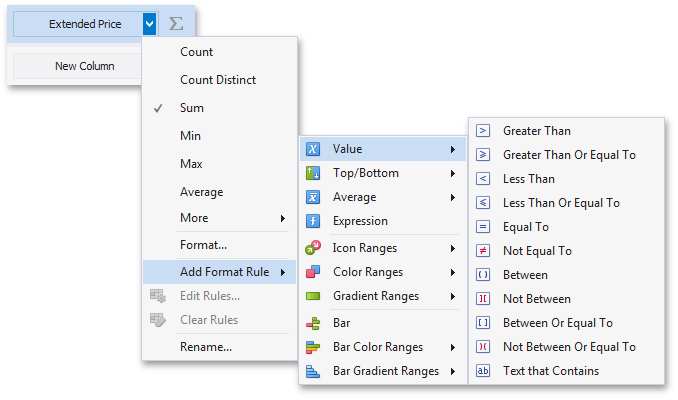
  • Click the Options next to the required measure/dimension. Select Add Format Rule and choose the condition.
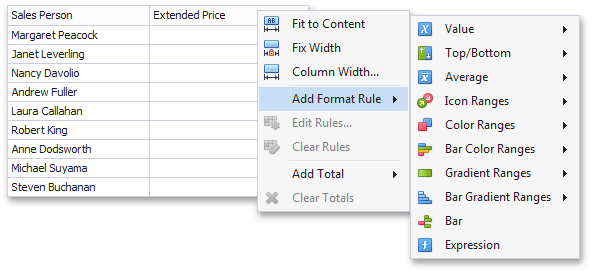
  • Right-click the column header corresponding to the required measure/dimension and select Add Format Rule.
  • Use the Edit Rules dialog. Depending on the selected format condition, the dialog used to create a format rule for Grid contains different settings. For instance, the image below displays the Greater Than dialog corresponding to the Value format condition.


Totals

The Grid dashboard item enables you to add a summary value (a total) calculated against displayed values of an individual column, and show the result under this column.

Note that you can add any number of totals for each column. For example, you can obtain the number of column records, average or maximum value, etc. You can create totals using different sets of summary functions. This depends on the type of the data source field providing data for the target column.

To create a total, use the context menu of the column header. Right-click the required column header, select Add Total and specify the type of summary function used to calculate a total. To change the total type, right-click the required total and select a new total type.
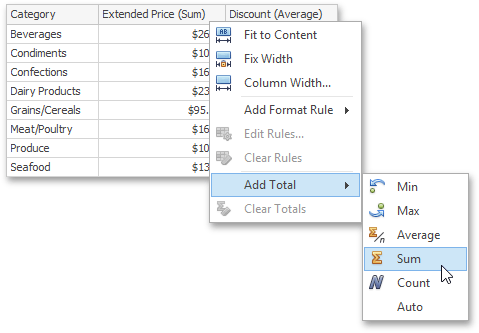
Other

To configure table layout, switch to Design tab on the ribbon and try to play with provided functions. For example, you may turn word wrapping feature to wrap words in table cells. Or use Banded rows button to colorize odd and even rows.

Tags:

reporting
widget
table
Analytics
quickreports
  • Share
  • History
  • More
  • Cancel
Related
Recommended
  • Our Terms of Use
  • Copyright
  • Privacy
  • Security
  • Anti-slavery Statement
  • Cookie Notice
  • YouTube