RWS Community
RWS Community
  • Site

Trados Studio

Trados Team

Trados Accelerate

Trados Enterprise

Trados GroupShare

Trados Business Manager

Passolo

MultiTerm

RWS AppStore

Connectors

Beta Groups

Managed Translation

MultiTrans

TMS

Trados Enterprise

WorldServer

Language Weaver

Language Weaver Edge

Language Weaver Connectors

Language Weaver in Trados Studio


Tridion Docs

Tridion Sites

Contenta

LiveContent

XPP

Trados Studio Ideas

Trados GroupShare Ideas

Trados Team Ideas

Trados Team Terminology Ideas

Trados Enterprise & Accelerate Ideas

Trados Business Manager Ideas

MultiTerm Ideas

Passolo Ideas

RWS Appstore Ideas

Tridion Docs Ideas

Tridion Sites Ideas

Language Weaver Ideas

Language Weaver Edge Ideas

Managed Translation - Enterprise Ideas

TMS Ideas

WorldServer Ideas

Trados Enterprise Ideas

XPP Ideas

GroupShare Developers

Language Cloud Developers

MultiTerm Developers

Passolo Developers

Trados Studio Developers

Managed Translation Developers

TMS Developers

WorldServer Developers

Tridion Docs Developers

XPP Developers

Language Combinations by Language Services

RWS Training & Certification

Style Guides

RWS Campus

Trados Approved Trainers

ETUG (European Trados User Group) Public Information

Nordic Tridion Docs User Group

Tridion West Coast User Group

Community Ops

demospace

RWS Community Internal Group

AURORA

Internal Trados Ideas

Linguistic Validation

Mercury

XPP Cloud

Recognition & Reward System

RWS Community Platform Related Questions

Community Solutions Hub (Trados)

Events

RWS Training & Certification

To RWS Support

  • Search
  • Translate

    Detecting language please wait for.......


    Powered by
  • User
  • Site
  • Search
  • User
  • Products
  • Trados Portfolio
  • Trados Business Manager
  • More
  • Cancel
Trados Business Manager
  • Products
  • Trados Portfolio
  • Trados Business Manager
  • More
  • Cancel

Trados Business Manager > Wiki

QuickReport items - Chart
  • Home
  • Blog and Product Updates
  • Forums
  • Wiki
  • Ideas
  • Docs
  • More
  • Cancel
  • New
Show Translation Options

Detecting language please wait for.......


Powered by
Trados Business Manager requires membership for participation - click to join
  • Wiki
  • +Licensing & Installation
  • -TBM 6
    • +Release Notes
    • +Basic Information
    • Quick Start
    • +Database engine
    • +Software configuration
    • +List views and data entry forms: usage and customization
    • Dashboards
    • +Reference data
    • +Documents
    • +Security system
    • +Service functions
    • +Data export and import
    • -Reports and analytics
      • +Custom reports
      • Ledger
      • -QuickReports
        • Built-in QuickReports
        • +Calculated fields
        • -Default widgets
          • QuickReport items - Cards
          • QuickReport items - Chart
          • QuickReport items - Choropleth map
          • QuickReport items - Gauges
          • QuickReport items - Grid
          • QuickReport items - Group
          • QuickReport items - Pies
          • QuickReport items - Pivot
          • QuickReport items - Range filter
          • QuickReport items - Scatter chart
          • QuickReport items - Tab container
        • Parameters
      • Vendors workload
    • +Invoice templates and custom reports
    • API
    • +Portal for customers
    • +Portal for Vendors
    • +Integrations in Business Manager
    • +CV
  • +Trados Business Manager Connector plugin
  • +Trados Business Manager plugin
  • +FAQ
  • TBM 5 documentation
  • Download links for older versions

QuickReport items - Chart

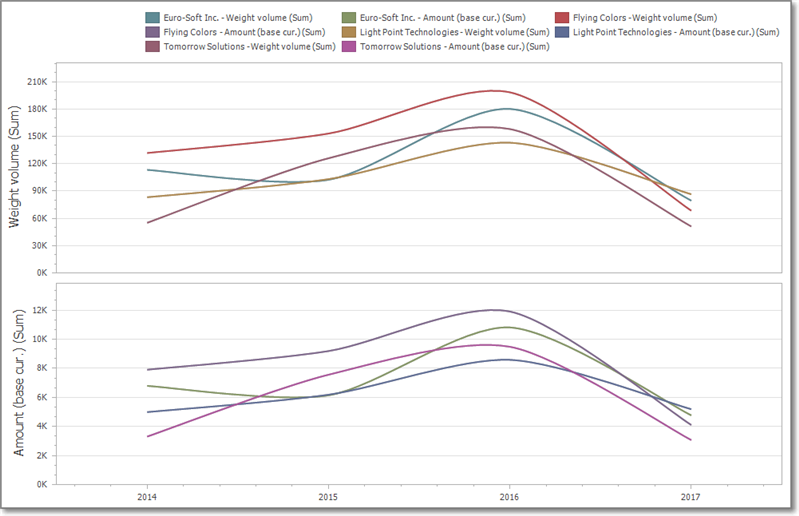
Chart displays data graphically using bars, lines, points, etc.

To bind the Chart item to data, drag and drop a data source field to a placeholder contained in one of the available data sections.

Transposing arguments and series

The Chart dashboard item provides the capability to transpose chart arguments and series. In this case, data items contained in the Arguments section are moved to the Series section, and vice versa.

To transpose the selected Chart item, use the Transpose button in the Home ribbon tab.
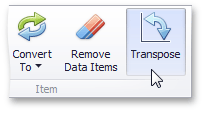
Series

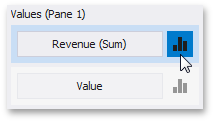
The Chart item supports different types of series - from simple bar and line charts to candle stick and bubble graphs. To switch between series types in the Dashboard Designer, click the Options button next to the required data item (or placeholder) in the Values section.
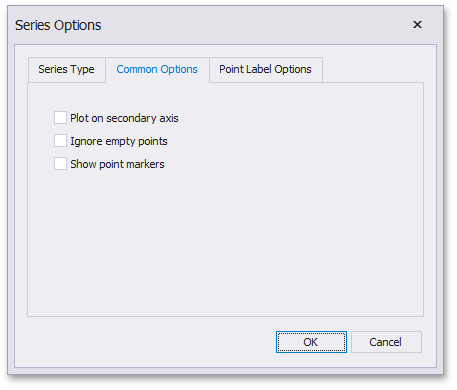
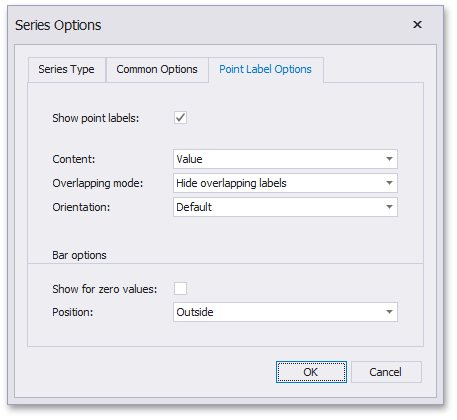
In the invoked Series Options dialog, select the required series type and click OK.
You can also do this using the Series Type gallery in the Design Ribbon tab.
To manage common series options, use the Common Options tab of the Series Options dialog.

Panes

The Chart item can contain any number of panes. Panes are visual areas within a diagram that display chart series.
Each pane has its own Y-axis and displays a specific set of series. All panes in a chart share the same X-axis.
To add a pane, click the Add Pane button at the top right of the Data items pane.

Interactivity - drill-down

The Chart item supports drill-down on argument or series values.
When drill-down on arguments is enabled, an end-user can click a series point to view a detail chart for the corresponding argument value. Drill-down on arguments requires that the Arguments section contains several data items, from the least detailed to the most detailed item.
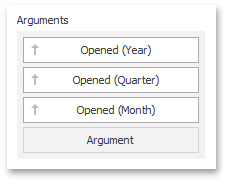
Switch to Data tab on the ribbon and click Drill-down button. From now, you will be able to click on chart points to get detailed information for quarters, and then for months.

Tags:

reporting
widget
Analytics
chart
quickreports
  • Share
  • History
  • More
  • Cancel
Related
Recommended
  • Our Terms of Use
  • Copyright
  • Privacy
  • Security
  • Anti-slavery Statement
  • Cookie Notice
  • YouTube