

To help you get familiarized with QuickReports feature, SDL Trados Business Manager contains a number of pre-defined reports. You are free to delete them or edit as you wish - these reports are created using default means and are not the part of the software.
Here is a list of pre-defined QuickReports:
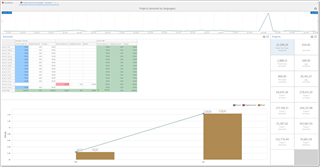
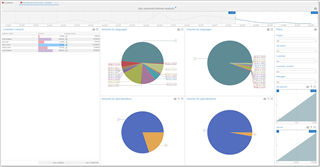
Dashboard (customers)
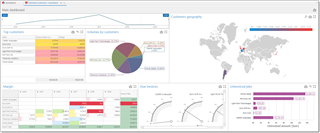
Time range control to quickly change report period, top customers table, volumes by customer, colored map showing world map with highlighted countries, pivot table to analyze margin by tears and customers, total amount of unpaid invoices by customers and amount of uninvoiced jobs.
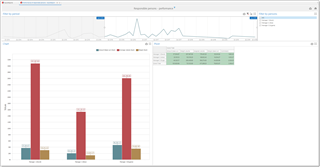
Performance report
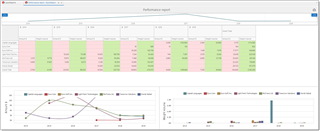
Allows to analyze your performance in terms of yeas and customers, showing total amount and average volumes in table and chat forms. In addition, contains interactive chart to analyze translation volumes by customers with year-quarter-month detalization.
Number of jobs
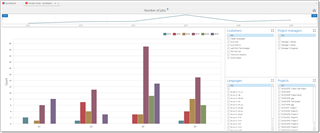
Simple report containing interactive chat displaying number of jobs you did in different periods.
Number of projects

Simple report containing a chat displaying number of projects in a specified period.
Available filters: customers, managers (responsible persons).
Time analysis
Displays different information about time you spend working on jobs. Charts display info by specializations and customers, as long as your performance by years. Pie chart is clickable and allows to view detailed data about each specialization category.
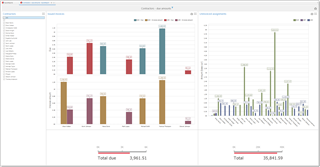
Earnings analysis
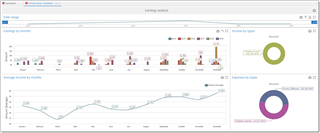
Allows to display and compare income/expenses for a selected period of time, along with average earnings and income/expense structure.
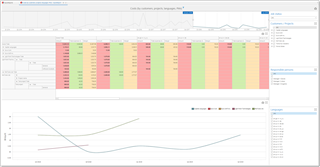
Profitability by time (pivot)
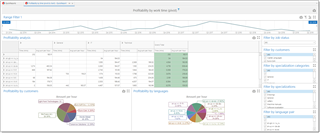
Allows to analyze time effectiveness and see earnings per hour for different languages, specializations, customers. Data is represented by expandable pivot table and two charts. You can quickly filter data using time range filter at top and a number of filter on the right.
Profitability by time(tabular)

Allows to analyze time effectiveness and see earnings per hour for all your jobs. Data is represented by simple table with applied formatting rules for better visualization of your results. You can quickly filter data using time range filter at top and a number of filter on the right.
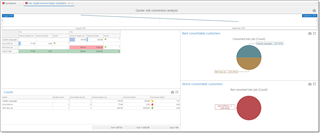
Jobs-Quotes conversion analysis

Allows to analyze how quotes are converted into real jobs. You can determine best and worst convertible customers, view amounts, conversion factor, number of jobs. Embedded bars and colorful icons highlight largest and smallest amounts for easier navigation in results.
Vendor performance
This report allow to view performance data of all or individual vendors, and contains the following widgets: Number of jobs (show number of assigned jobs with statuses over selected time period), Unpaid assignments (list of unpaid assignments along with statuses, amounts and other data), Top specializations (shows average volume by specializations), Amounts by currencies chart (shows full amounts, due and paid amounts in each assignment currency), Average rating (shows average rating in a specified period). By default, Vendor role allows translators to view this report from their account. The only difference is that vendors can only view their own data, not data of other vendors.
Customers - List of jobs
Allows to quickly view jobs for a selected customer in a specified time period.
Built-in graphs visualize job amounts and volumes for easier navigation.
Performance of responsible persons
Displays amounts and volumes processed by selected managers in a specified period of time. Allows to calculate manager's commission based on percentage specified in the report settings.
Contractors - Due amounts
Allows to display due and full amounts earned by vendors in a specified period of time. Possible to filter by assignment statuses, language pairs and vendors.
Costs (by customers, projects, languages, PMs)
This report displays amounts, expenses and total margin by customers in a form of pivot table and linear chart. Pivot table allows to additionally analyze data by customer projects, managers and specializations.
Available filters: time period, customers, projects, managers (responsible persons) and language pairs.
Costs (by vendors)
This report displays amounts of source jobs and assignments, as well as margin amount per vendors. Pivot table allows highlights highest and lowest amounts and margins.
Available filters: time period, vendors, managers (responsible persons) and language pairs.
Projects (amounts by languages)
Allows to select a report and analyze project amounts, assigned amounts and margins by managers in a certain period of time.
Additional chart displays same values by months.
Projects (amounts/volumes analysis)
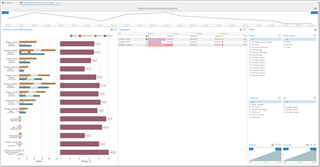
One of the most powerful and flexible reports. Main goal is to analyze project effectiveness by managers. It contains two widgets: chart and table. Chart displays amounts and margins of projects, as well as effectiveness expressed in percents. Table contains total data by managers and average margin, highlighting better performing managers.
Available filters: projects, customers, managers, project amount range and volume range.
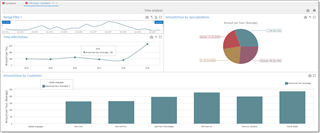
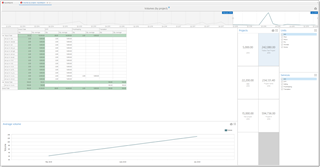
Volumes (by customers)
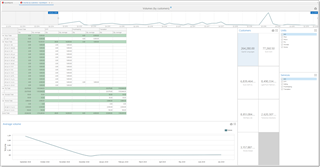
This report displays volumes (total and average) by languages, units and services for a selected customer. Additional linear chart displays average volume change over time.
Available filters: time period, customers, units, services.
Volumes (by managers)
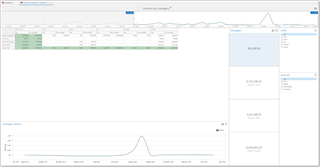
This report displays volumes (total and average) by customers and units for a selected vendor. Additional linear chart displays average volume change over time.
Available filters: time period, managers, units, services.
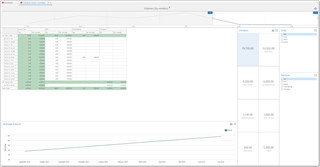
Volumes (by project)
This report displays volumes (total and average) by units, languages and services for a selected project. Additional linear chart displays average volume change over time.
Available filters: time period, projects, units, services.
Volumes (by vendors)
This report displays volumes (total and average) by units, languages and services for a selected vendor. Additional linear chart displays average volume change over time.
Available filters: time period, vendors, units, services.
Translation project management system - Vendor performance
Volumes (tree map)
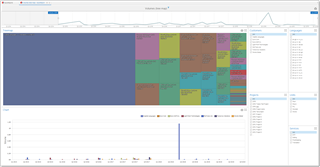
This report displays best customer and language pairs in terms of volumes. Additional chart displays average volume change over time by customers.
Available filters: time period, customers, projects, languages, units and services.
Productivity dashboard
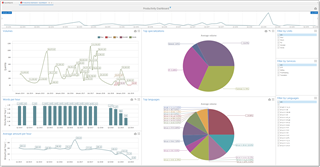
This report is about time tracking and performance. It allows to view translation volumes over certain period, speed an income per hour, top specializations and language pairs. Four filters (by date, unit, work type and language pair) allow to control displayable data.
Average volume chart is interactive and allows to click on pies to view detailed chard by specialization category.
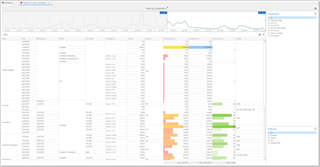
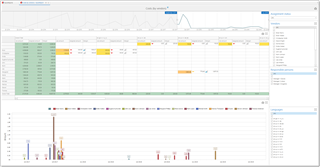
Jobs (amounts/volumes analysis)
Displays aggregate amounts and volumes by jobs during specified period of time in terms of language pairs and specializations. Additionally, contains a table with customer contacts (project managers) with amounts and volumes processed with them. List of filters allows to additionally filter data by projects, job statuses, customers, customer contacts, own project managers, job amounts and job volumes.